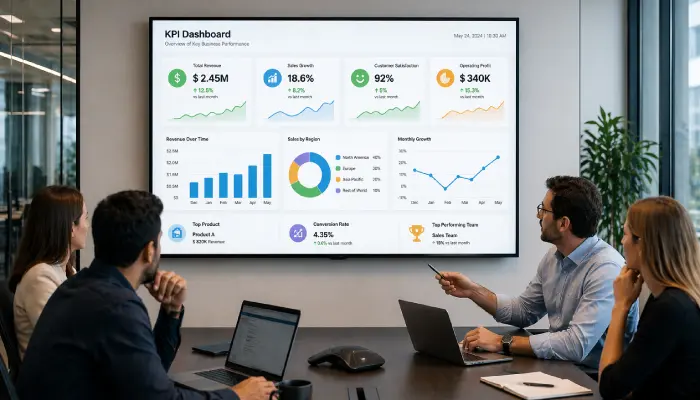
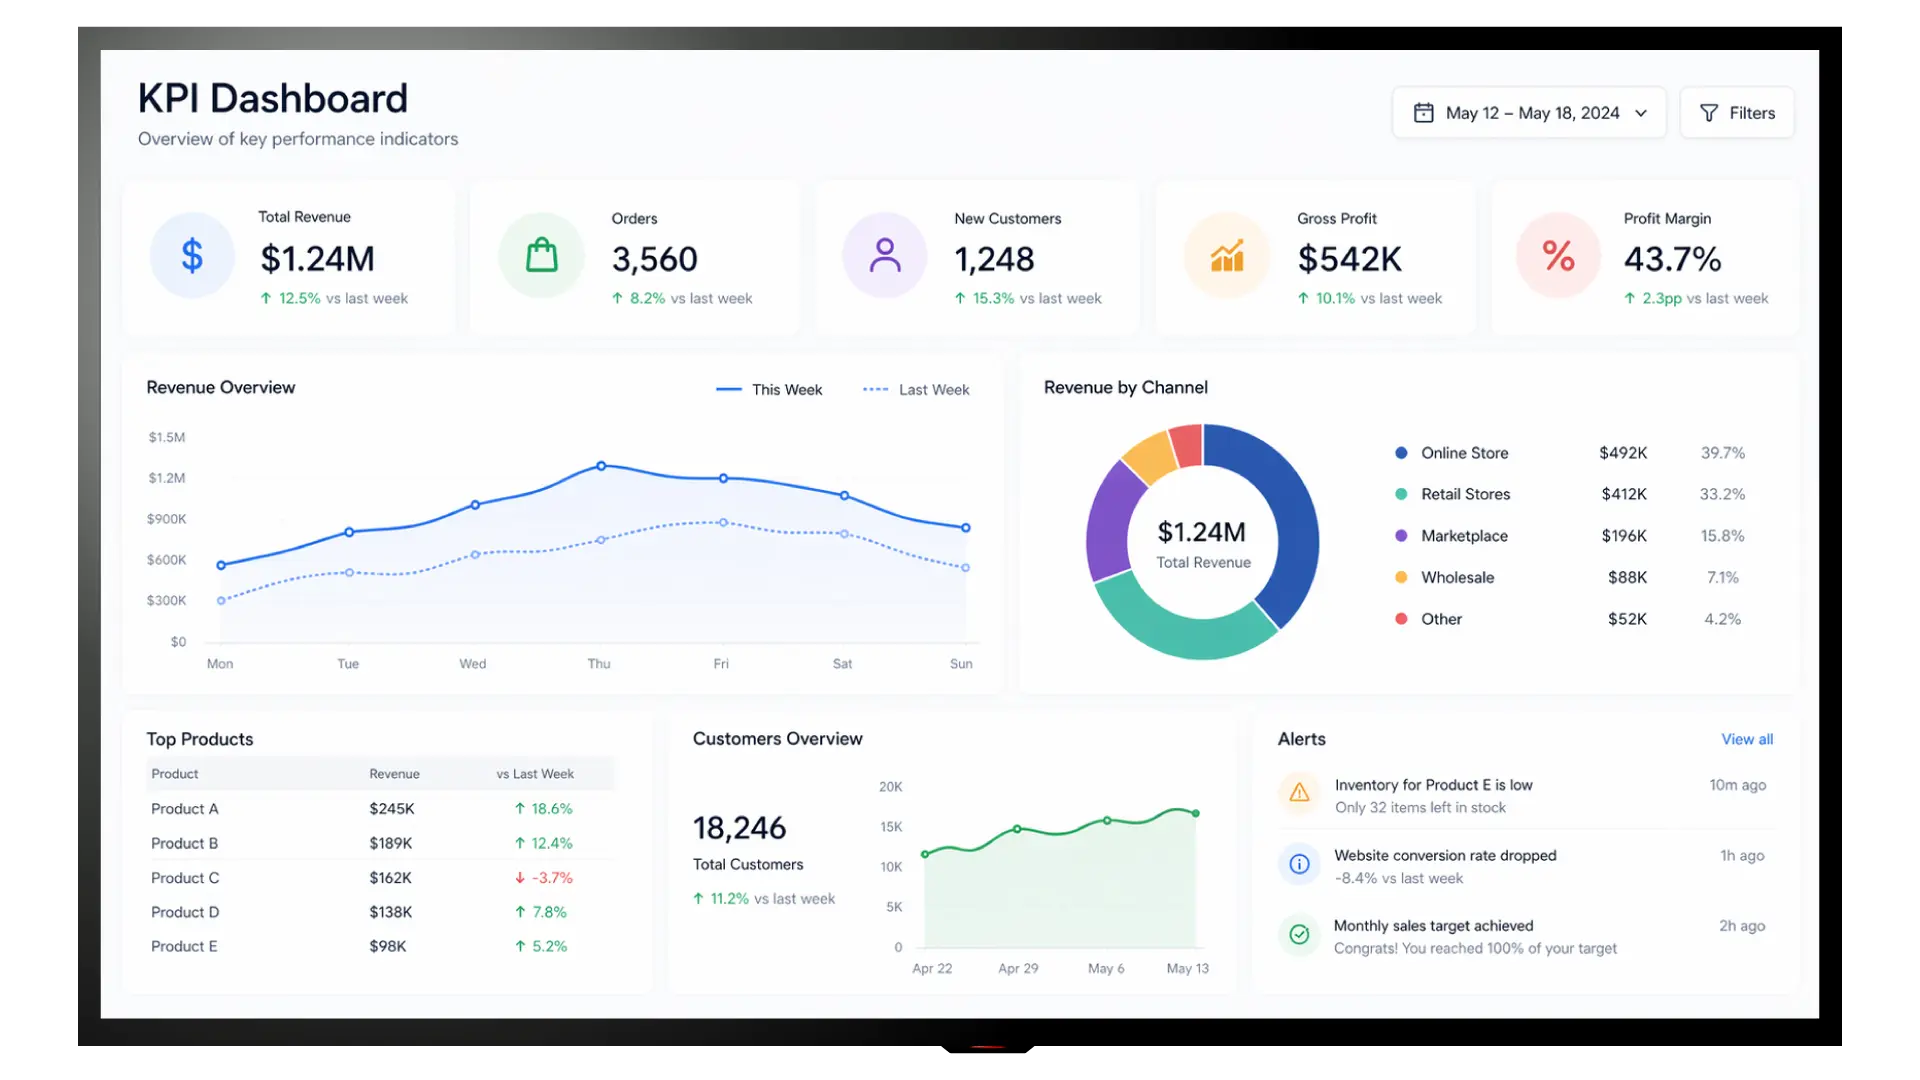
KPI Dashboards
Display live business metrics, sales targets, production stats, and performance data on office or factory floor screens to keep every team aligned.
- Live data from Power BI, Tableau & more
- Sales, production and ops metrics
- Auto-refreshing dashboards
- Role-specific screen content by location

Perfect for
Operations managers, sales teams, and executives who need live performance data visible on the floor.
How it works
Set up your first screen in minutes. No technical skills required.
Connect your data source
Link Power BI, Tableau, Looker Studio, or Geckoboard to EasySignage. If it has a URL, it can go on a screen.
Choose your screens
Select which TVs or monitors in your office, factory, or warehouse will display each dashboard.
Publish and schedule
Assign different dashboards to different screen groups, sales data for the sales floor, production stats for the factory.
Data refreshes automatically
Your dashboards update in real time so the metrics on screen always reflect the current state of your business.
Why Display KPIs on Screens?
Visible performance data motivates teams, surfaces issues faster, and creates a culture of transparency and accountability.
Always-On Visibility
Keep key metrics permanently visible on office and factory floor screens so every team member can see progress without opening a laptop.
Any BI Tool, Any URL
If your dashboard has a web address, it can go on a screen, no plugins, no coding, no extra software needed.
Works on Any Screen
Deploy on TVs, monitors, or large format displays anywhere in your facility with no proprietary hardware.
Auto-Refreshing Data
Dashboards refresh automatically so the data on screen always reflects the current state of your business.
Role-Based Screen Groups
Show the right data to the right team, sales figures for the sales floor, production stats for the warehouse, and exec summaries in boardrooms.
Locally Hosted Dashboards
Display dashboards from your own servers or internal network. Your data stays within your infrastructure, no third-party cloud involved. Ideal for strict data residency or compliance requirements.
Recommended apps
These EasySignage apps work best for kpi dashboards.
Frequently asked questions
Ready to get started?
Set up your first kpi dashboards in under 10 minutes.
Start for Free — 1 Screen ForeverNo credit card required. FREE for 1 screen!