What Are the Best Four Business Intelligence Dashboards Software?

Having massive data volumes has compelled companies to rethink their approach. They are looking for adequate assistance when it comes to making profitable decisions. Business Intelligence Dashboard Software is the solution for which most companies have been searching.
These tools step up into collection, monitoring, analysis, and anticipating future business scenarios by crafting a clear perspective from company data. It displays the status of key performance indicators (KPIs) and several essential business metrics for an organization.
Typically, a BI dashboard contains multiple data visualizations to provide users with a combined view of relevant trends and KPIs. These reports are more interactive than static reports.
According to a report generated by Apps Run the World (2020), the worldwide business intelligence market will likely reach $17.6 billion by 2024.
The Benefits of Business Intelligence (BI) Tools
Professional tools and software offer a wide variety of perks. Below we have listed some of the most invaluable ones:
Users can take advantage of the predictions: Intelligent data alerts will help safeguard anomalies that can occur while handling a massive amount of data. It also allows users to discover new patterns and trends.
They reduce manual tasks: It eliminates endless amounts of rows and columns. Instead, it facilitates the automation of procedures with specific time intervals.
They gather relevant data: The modern data connectors will help you centralize the disparate sources and provide a single view of all business KPIs.
Hence, if an organization wants to control data and know what is going on in your company, Business Intelligence Software will help you.
Best Business Intelligence Dashboards Software
We have created a list of the four best business intelligence software that could be your savior in the darkest of times. In a period when you feel there is nothing that could help your venture, these programs will help you stay afloat:
Google Data Studio:
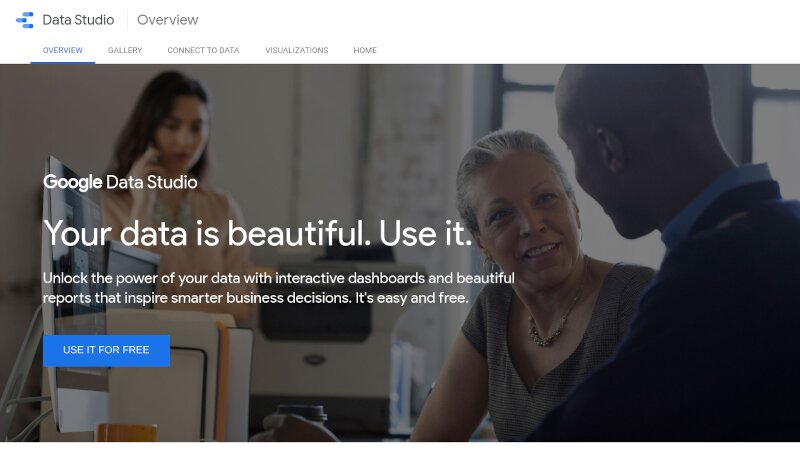
Google Data Studio is a web-based platform where you can create interactive reports designed to help you make better decisions based on your data. The goal of these reports is to make it easier for business owners and marketing professionals to visualize their website traffic, lead generation, audience, bounce rate, and social media referral traffic, helping them make educated decisions on marketing tactics.
Google Data Studio makes it incredibly easy for businesses to share data in real-time. It provides a platform that everyone, from the CEO to low-level employees, can understand and interact with; this is critical when getting everyone on board with making improvements to their business or product.
Google Data Studio started from within Google Analytics 360, but in 2018 this product was released as a standalone service. It is an entry-level suite that helps business owners and other professionals visualize their data by creating charts, tables, and graphs to help tell the story of a business. With this tool, users can create reports and an easy-to-read dashboard with just a few clicks. Some key features include:
- Customizable templates give users a head start with highly functional dashboards without advanced technical know-how.
- Drag and drop functionality provides a simple way to create color-coded charts and graphs that tell the story of the data on a single page.
- Integration with BigQuery, Google Analytics 360 Suite, YouTube Analytics 360 Suite, Salesforce, Microsoft Office 365 Power BI, Github, and much more
Tableau:
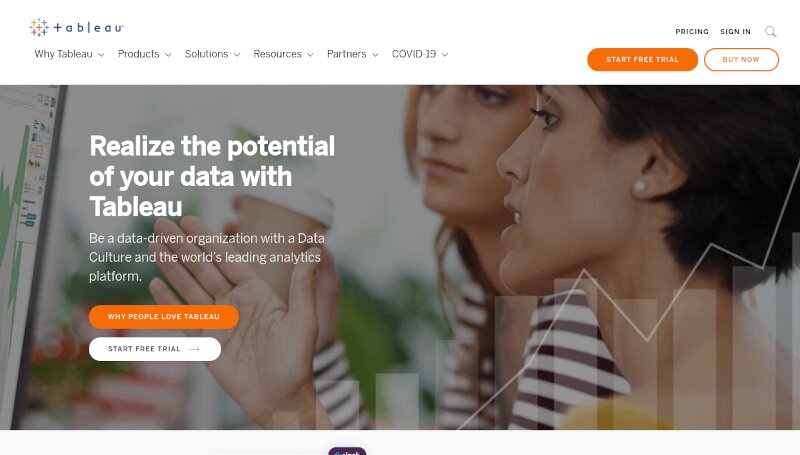
Tableau is a business intelligence software to analyze the data crucial to business decisions visually. Launched in 2003, Tableau has taken less than a decade to emerge as one of the top companies offering business intelligence solutions globally. The company boasts of an annual growth rate of more than 50 percent and has made customers in 170 countries worldwide. Some companies using Tableau for their business intelligence include Chevron, ESPN, Sales.
Tableau provides a simple drag and drop interface that allows users to create an interactive visualization with just a few clicks. One of the main strengths of this software is its ability to perform ad-hoc analysis on big data volumes by slicing, drilling down, and pivoting. It brings together the ability to analyze, visualize and publish information in one easy-to-use platform.
The software can be used by anyone, no matter how much experience they have with business intelligence products in the past. A few of the most sought-after features of Tableau include the following:
- Interactive visual analysis, dashboard publishing, and data blending.
- Drag-and-drop interface that allows users to quickly and easily create charts without having to write code or SQL queries
- A mobile app that lets users connect to the Tableau server and run analytics from anywhere, similar to cloud-based work systems.
- Available “workspaces” for easier data sharing for multiple users in a cross-functional team.
- Simple Integration with other programs, including Microsoft Excel and Google Sheets.
Microsoft Power BI:
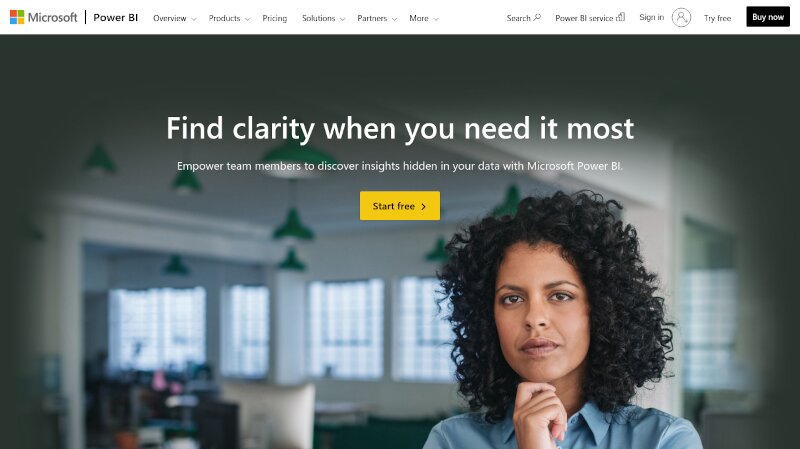
Business owners have been challenged with how. to track and analyze their data effectively, but leave it to the team at Microsoft to provide a robust and integrated system to help them do just that. Microsoft Power BI, a comprehensive business intelligence platform, is driven by an integrated suite of powerful analytic tools that deliver insights across traditional and new data sources, including the Internet of Things (IoT). The system provides a 360-degree view ofthe organization’s operations so teams can make informed decisions on what matters most.
Microsoft Power BI was launched in 2014 as a cloud-based business intelligence service designed to make data analytics accessible for users who don’t have the money, expertise, or time to implement traditional Business Intelligence systems. With Power BI, all a company needs Office 365 and an internet connection; Microsoft Azure provides the infrastructure behind the scenes. It enables employees in an organization to access real-time data and immediately act on insights using standard Office tools such as Excel and PowerPoint. Four of the most outstanding features of Microsoft Power BI include:
- Power Query - A data connector that enables data extracting, transforming, and loading. It also offers an environment to build custom data models.
- Power Pivot - Enables users to bring their data together from various sources into one place and build automated relationships between tables, allowing the user to derive a single, cohesive picture of the most critical data.
- Visual Designer - Provides a comprehensive view of the data model-created reports that can be embedded directly in Office documents.
- Data For All - Data access for any authorized users without the need for coding or SQL knowledge.
Looker:
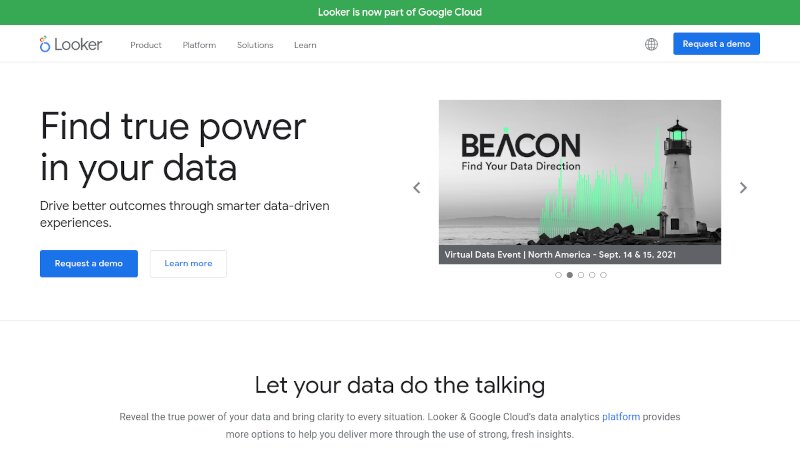
Looker is a business intelligence tool that removes the complexity of data and allows users to explore, analyze, and visualize their data. With Looker, users can create dashboards with custom widgets and visualizations. Clients can also embed custom dashboards in any web page or mobile app through API, making it easier to share data.
Looker was founded in 2012 by Lloyd Tabb, Jeff Hammerbacher (Facebook’s first-ever Data Scientist), Hilary Mason (Chief Data Officer at Bitly), and Kevin Scott (former Director of Advanced Analytics for Netflix).
Looker is entirely cloud-based and doesn’t require software to be installed on sites. The software is gaining popularity, with more than 350 companies currently using Looker for their data analysis, including Airbnb, Amazon, Cisco, CitiGroup, Nielsen, and Salesforce. According to the Content Marketing Institute, more than half of all marketers use data from multiple sources (e.g., Google Analytics, Facebook, Twitter), which can be challenging to pull together for a birds-eye view of data. Looker’s flexible architecture makes it easy to integrate with third-party data sources or build custom connectors to bring all the sources together for a more robust picture of where a company stands. Some of the impressive features of Looker include:
Looker Data Sources - Bring data from a database into the software with connectors for major databases, including Postgres, MySQL, Redshift, external APIs, CSV files, and more.
Looker Charts - Change how data is organized and visualize it with various charts, including bar and line graphs, area and heat maps, funnel analysis, etc.
Gadgets or Apps - All widgets are called gadgets in Looker. Developers can build apps that create custom dashboards from a collection of grouped gadgets. All gadgets can be connected through a single API, making it easy for users to explore and visualize data from different sources.
Find - Using Looker’s search bar, users can find data by searching a column name or value. The software also generates reports based on date ranges and categories.
Parting Thoughts
The business adoption of big data is still a struggle despite all the perks it carries along. 73.4% of the organizations view it as a constant challenge. Meanwhile, a mere 37.8% of the firms report creating a data-driven organization. And only 26.8% consider themselves successful at building a data-driven culture (NewVantage Partners, 2020).
Using either of these four best BI tools can help companies achieve their productivity outcomes and maintain a competitive edge. Be sure to explore further options before picking any BI software so you can find the best solution for your organization.