Is Your Digital Signage Worth It? Here’s How to Measure ROI
You have set up your digital signage screens, and the content is live. People are looking at them, but is it actually effective? That’s the question most businesses forget to ask until budget review comes around.
Measuring the ROI of digital signage doesn’t have to be complicated. You just need to know what to track and how to connect it back to real business results.
Here’s a simple guide to help you do exactly that.
First, What Does ROI Mean for Digital Signage?
ROI, return on investment, sounds like a finance term, but it’s really just one simple question: did what I spend give me back more than it cost?
Think of it this way. You put up a screen. It shows a promotion. A customer sees it and buys. That’s ROI in action.
For digital signage, that return doesn’t always show up as direct sales. It can come in many forms:
- More sales from promotions displayed on screen
- Lower operational costs where fewer staff hours spent on printing and updating notices
- Higher customer satisfaction (shorter wait times, better info)
- More engagement with your brand or message
The best part? All of these are measurable. You don’t need a finance degree — just the right things to track.
How to Calculate Digital Signage ROI
When measuring digital signage ROI, the focus should not be on tracking everything; it should be on monitoring what matters for your business.
Step 1: Set a Clear Goal Before You Launch
You can’t measure success without knowing what success looks like. Before your screens go live, pick one primary goal.
For example:
- Increase sales of a promoted product by 15%
- Reduce customer complaints about wait times
- Drive more foot traffic to a specific area of your store
- Improve employee awareness of company announcements
A clear goal gives you a benchmark to measure against later.
Step 2: Track the Right Numbers
Here are the most common metrics businesses use:
1. Sales Lift
Compare sales of a promoted product before and after displaying it on your screens. Even a 10–20% bump is a strong signal that your signage is working.
To track this accurately, note your baseline sales numbers before activating signage for a specific product, then measure again after two to four weeks. The more consistently you do this, the clearer your ROI picture becomes.
2. Dwell Time
Are customers spending more time in front of your displays? Longer dwell time usually means your content is engaging and doing its job.
Tools like EasySignage AI Analytics make this easy to measure automatically. The platform’s AI tracks dwell time in real time, detecting how long each viewer stands in front of a screen, without capturing any personal data, keeping it fully GDPR-compliant.
Businesses can use this data directly to calculate ROI: by comparing dwell time before and after updating content or campaigns, you can see which content holds attention longest and allocate budget accordingly. A longer average dwell time tied to a specific promotion, for example, gives you concrete evidence that the content drove engagement.
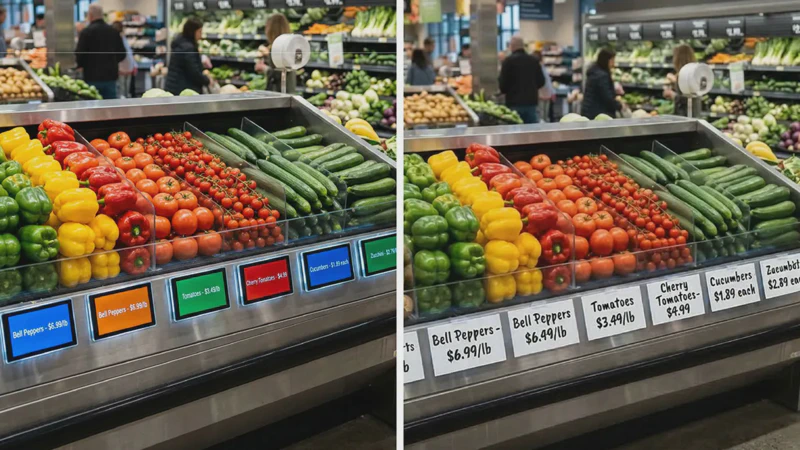
3. Operational Savings
How much did you spend on printing flyers, posters, or menus before switching to digital signage? Add up those old costs; you might be surprised by how much you’re saving.
Consider the cost of design time, paper, ink, and the staff hours spent swapping printed materials. A single cloud-based digital signage subscription like EasySignage often replaces all of these costs. Plus, the savings increase over time as you add more screens.
4. Customer Satisfaction Scores
If your screens show wait times, product info, or helpful directions, ask customers if they found the information useful. A simple survey or NPS score works well here.
If scores improve after deploying informational or wait-time content, that’s a measurable indicator that your signage is adding real value to the customer experience.
Step 3: Use a Simple ROI Formula
You don’t need a spreadsheet or an accountant for this. Here’s the basic formula you can use:
ROI (%) = ((Total Benefit – Total Cost) ÷ Total Cost) × 100
A quick example:
Say you’re paying $500/year on EasySignage. Over that year:
- Your promoted products bring in an extra $2,000 in sales
- You stop printing costs and menus, saving $300 in printing costs
- That’s a total benefit of $2,300
Plug it into the formula:
ROI = (($2,300 – $500) ÷ $500) × 100 = 360%
That means for every $1 you spent, you got back $3.60. Not bad for a few screens.
And this is a conservative example, it doesn’t even account for time saved by your staff, improved customer experience, or the long-term value of repeat customers who kept coming back because your space felt more professional and engaging.
The numbers add up faster than most people expect.
Step 4: Review and Improve Your Content Regularly
ROI isn’t a one-time check. The best-performing businesses treat digital signage as an ongoing channel, not a set-it-and-forget-it tool.
With EasySignage, you can update content instantly from any device. That means you can:
A/B test your promotions: run two versions of the same offer and see which one performs better. For example, show a “Buy 1 Get 1 Free” promotion on one screen and a “50% Off Today Only” deal on another, then compare which drives more sales over the same period. You can also test the same promotion at different times of day to find your sweet spot.
Schedule content for peak hours: show your best offers when foot traffic is highest, whether that’s the morning rush, lunchtime, or the after-work crowd.
Swap out underperforming content in minutes: no design team, no IT department, no waiting. If something isn’t working, change it on the spot and move on.
Think of your screens the same way you’d think of a social media post, the first version is rarely the best one. The magic happens when you keep testing, learning, and refining.
The easier it is to change your content, the faster your ROI grows.

How Long Does It Take to See ROI from Digital Signage?
Most businesses start seeing results within the first 30–90 days, especially when screens are used to promote products or reduce staff workload. The timeline varies depending on what you’re measuring:
Operational savings, like reduced printing and fewer staff hours, can often be felt within the first month.
Sales lift from promotional content typically shows measurable results within two to four weeks if you’re tracking baseline numbers.
Engagement metrics like dwell time and viewer counts can be monitored from day one with AI analytics tools like EasySignage.
For broader ROI across multiple screens and goals, most businesses have a clear picture within 90 days. The key is starting with that defined goal from Step 1, so you know exactly what to look for and when.
Common Mistakes That Hurt Digital Signage ROI
Even well-intentioned digital signage setups can underperform if a few key things are overlooked. No clear call to action on screen is one of the most common issues; viewers see content but don’t know what to do next.
Stale or rarely updated content is another: if the screen shows the same promotion for weeks, people stop noticing it.
Poor placement is also a factor; a screen tucked in a corner with low foot traffic or awkward viewing angles will naturally show weak engagement metrics.
Finally, not tracking anything at all means you can’t improve what isn’t working. Setting up a simple measurement routine from the start, even just checking sales numbers weekly, makes a significant difference to your results over time.
Is Digital Signage Worth the Investment?
For most businesses, the answer is a clear YES, and the numbers back it up. Studies show that digital signage can increase sales by up to 33%, and customers who feel informed and engaged are far less likely to leave without making a purchase.
But here’s the thing: digital signage only pays off when it’s done right. A screen showing outdated content or irrelevant promotions won’t move the needle. The businesses that see real returns are the ones that start with a clear goal, track the right numbers, and keep their content fresh and relevant.
Choose a platform that makes your content management easy. EasySignage gives you everything you need to get started quickly, manage content from anywhere, and see real results without a big upfront commitment:
- No tech skills needed: set up your first screen in minutes
- Instant content updates: change content from any device, anywhere
- Start for free: your first screen is always free, no credit card required
You don’t have to take our word for it. Try it yourself, track your numbers, and let the results speak for themselves.
Start free at EasySignage.com — no credit card, no commitment. Just results.
Frequently Asked Questions
Q: What is a good ROI for digital signage?
A: Any ROI above 100% means you’re getting back more than you spent, which is a solid benchmark. Many businesses using digital signage for promotions report ROI in the range of 200–400% once operational savings are factored in alongside sales lift, as shown in the formula example above.
Q: Can small businesses measure digital signage ROI?
A: Absolutely. You don’t need complex analytics software to get started. Even simple before-and-after comparisons of sales or a short customer survey can give you meaningful data.
As your setup grows, tools like EasySignage AI provide automated audience insights, including viewer counts and dwell time, without requiring any technical expertise.
Q: What’s the best way to test and optimize my digital signage content?
A: The most effective technique is A/B testing, and it’s simpler than it sounds. Start by running two versions of the same content and comparing which one performs better.
For example:
- Show “Buy 1 Get 1 Free” on one screen and “20% Off Today Only” on another, then track which drives more sales over the same period.
- Run the same promotion at different times of day, morning vs. afternoon, to find when your audience is most responsive.
- Test two different designs of the same message: one image-heavy, one text-focused, and see which gets more attention.
The key is to change one thing at a time. That way, you know exactly what made the difference.
A good rule of thumb: run each version for at least a week before drawing conclusions, and always tie results back to a measurable metric: sales, footfall, or customer feedback.
Q: How much does digital signage cost per month?
A: The cost varies by provider and plan. EasySignage offers a free plan for a single screen, making it one of the most accessible entry points for businesses wanting to test the ROI before committing to a paid subscription. This low barrier to entry means the financial risk is minimal while the potential upside, reduced printing costs, increased sales, and better customer experience, begins immediately.
For more more about How Much Does Digital Signage Cost.
Q: Does digital signage ROI differ by industry?
A: Yes. Retail and restaurants tend to see the fastest and most measurable ROI because screens directly influence purchasing decisions at the point of sale. Healthcare and corporate environments see ROI more through operational efficiency, fewer printed notices, faster communication, and reduced staff time spent on manual updates.
Q: Do I need multiple screens to see a good ROI?
A: Not at all. Even a single well-placed screen showing the right content at the right time can deliver strong returns. Many businesses start with one screen, measure the impact, and expand from there.